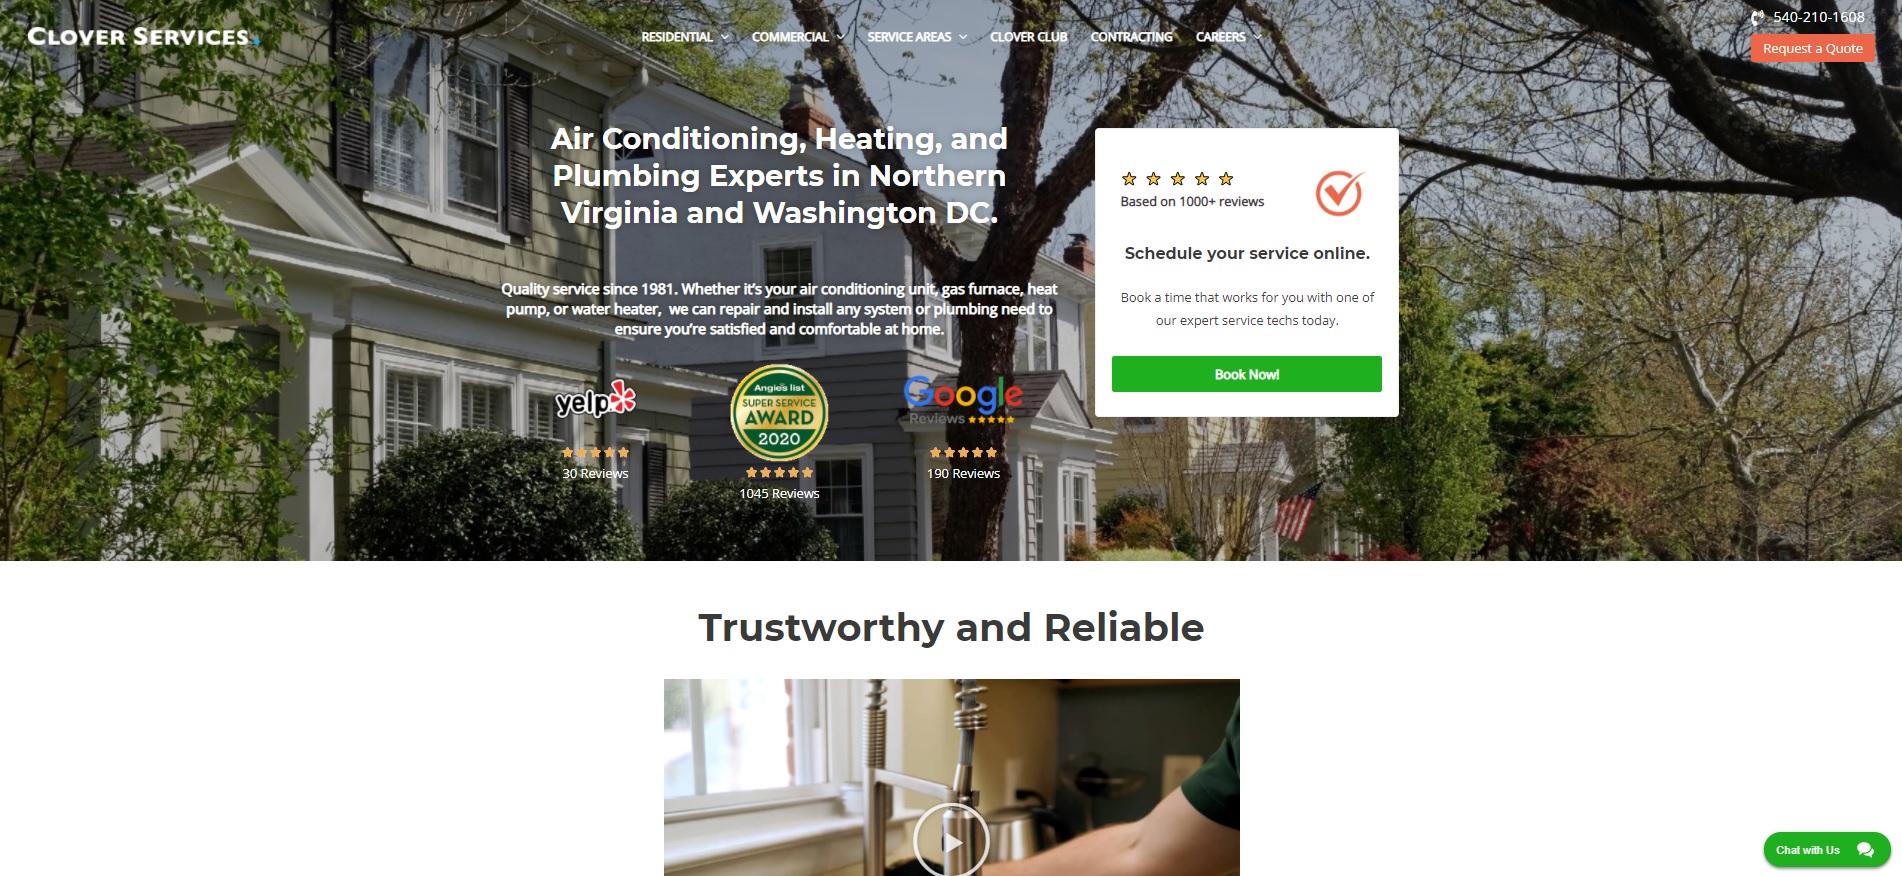
Clover Services: Leads & Revenue
Client Situation
Clover Services, a leading HVAC and plumbing company, has demonstrated remarkable growth over the past two years. This case study compares the marketing performance metrics from October 2021 to October 2023, highlighting the substantial improvements in leads, sold jobs, revenue, and return on ad spend (ROAS) across various marketing channels.
Results
- Overall Growth: Clover Services’ overall marketing performance saw exceptional improvement from October 2021 to October 2023. The company experienced a 639% increase in leads (from 51 to 377), a 280% increase in sold jobs (from 20 to 76), and a 182% increase in revenue (from $19,489 to $54,900). The return on ad spend also improved significantly, by 560%, indicating a much more efficient use of marketing budgets and greater profitability.
- SEO Channel: The SEO channel showed remarkable performance, with a 406% increase in leads (from 31 to 157) and a 145% increase in sold jobs (from 11 to 27). Revenue from SEO saw a substantial increase of 322% (from $7,600 to $32,060), and the return on ad spend improved dramatically by 447% (from 1.5 to 8.2). This indicates that the SEO efforts were highly effective in attracting and converting high-value customers.
- Google LSA Channel: This channel exhibited significant growth. Leads increased by 175% (from 8 to 22), sold jobs by 100% (from 5 to 10), and revenue by 342% (from $801 to $3,540). The return on ad spend improved by 53% (from 5.1 to 7.8), indicating a solid return on investment and successful optimization of the channel to drive customer acquisition and revenue growth.
- Google Ads Channel: The Google Ads channel demonstrated the most dramatic improvements. Leads increased by 533% (from 9 to 57), sold jobs by 1300% (from 2 to 28), and revenue by an impressive 1524% (from $795 to $12,900). The return on ad spend improved by 125% (from 3.2 to 7.2), showcasing the effectiveness of the paid search efforts in generating substantial business growth and high returns on investment.
Overview of Marketing Performance
October 2021 vs. October 2023 – All Marketing Channels
Metric | October 2021 | October 2023 | % Change |
Leads | 51 | 377 | +639% |
Sold Jobs | 20 | 76 | +280% |
Revenue | $19,489 | $54,900 | +182% |
Return on Ad Spend | 1.5 | 9.9 | +560% |
October 2021 vs. October 2023 – SEO Channel
Metric | October 2021 | October 2023 | % Change |
Leads | 31 | 157 | +406% |
Sold Jobs | 11 | 27 | +145% |
Revenue | $7,600 | $32,060 | +322% |
Return on Ad Spend | 1.5 | 8.2 | +447% |
October 2021 vs. October 2023 – Google LSA Channel
Metric | October 2021 | October 2023 | % Change |
Leads | 8 | 22 | +175% |
Sold Jobs | 5 | 10 | +100% |
Revenue | $801 | $3,540 | +342% |
Return on Ad Spend | 5.1 | 7.8 | +53% |
October 2021 vs. October 2023 – Google Ads Channel
Metric | October 2021 | October 2023 | % Change |
Leads | 9 | 57 | +533% |
Sold Jobs | 2 | 28 | +1300% |
Revenue | $795 | $12,900 | +1524% |
Return on Ad Spend | 3.2 | 7.2 | +125% |
Conclusion
Clover Services’ strategic enhancements in marketing have yielded extraordinary results across all key metrics over the analyzed period. The significant improvements in leads, sold jobs, revenue, and return on ad spend across various channels highlight the company’s effective marketing strategies and execution. These results underscore Clover Services’ successful adaptation to market demands and its ability to leverage digital marketing channels to drive substantial business growth.
With continued focus and optimization, Clover Services is well-positioned to maintain its growth trajectory and further enhance its market presence in the plumbing industry.
Explore why hundreds of companies in SaaS and home services industries trust Build Media Group to grow their business.


